Trading language evolves.
Support and resistance have been around for generations. Supply and demand zones became common language for many retail traders. More recently, terms such as liquidity, liquidity sweep, order block, fair value gap, imbalance, and displacement have become almost impossible to avoid on trading social media.
Some of those ideas are useful.
Some are old market behaviours described with newer labels.
And some are presented with far more certainty than the chart can actually justify.
That distinction matters.
If a concept helps you describe price consistently, define risk, and test a repeatable setup, it can be useful. If the concept encourages you to tell a story about invisible institutional orders you cannot actually observe, it can become dangerous very quickly.
So in this article I want to separate three things:
- What we can genuinely observe or measure.
- What we can reasonably infer from price behaviour.
- What becomes speculation when traders present it as fact.
That is the framework I think makes these ideas genuinely useful.
Start with what liquidity actually means
In professional market language, liquidity describes how easily an asset can be bought or sold in meaningful size without causing excessive price movement.
The Bank for International Settlements describes market liquidity in terms of the cost and time required to transact, including execution relative to the bid-ask spread, market impact, and immediacy.
That is important because liquidity is not simply volume.
A market can trade enormous volume during a volatile period while available depth becomes thinner. CME Group has published research showing exactly why order-book depth should not be treated as a complete measure of liquidity. Fill quality, price impact, spread, depth, and rate of trading all matter.
This is the first distinction traders should understand.
When a futures trader talks about actual market depth, there may be a central limit order book that shows resting bids and offers. CME’s Market by Order documentation describes a feed that can show individual orders, queue position, and full depth of book. The CFTC’s futures glossary also defines an order book as a market structure where bids and offers are matched according to price and/or time priority.
That is observable market data.
A candle chart is different.
A candle can show us where price traded. It cannot show us the identity of every participant, every resting order, or the motivation behind every transaction.
That does not make chart analysis useless.
It simply means we have to be precise about what we know.
What traders mean by a liquidity pool
In modern price-action language, a liquidity pool usually means an area where traders believe orders are likely to cluster.
Common examples include:
- Above a prominent swing high
- Below a prominent swing low
- Above equal highs
- Below equal lows
- Outside an obvious range
- Beyond a widely watched support or resistance area
Why might orders cluster there?
Imagine price has rejected the same high twice.
Some traders are short and may place stop-loss orders above that high. Other traders are waiting for a breakout and may place buy-stop orders above it. Some existing long traders may use the area as a target.
So it is reasonable to say that an obvious high may attract order activity.
It is not reasonable to say, simply from the chart, that we know exactly how many orders are there or who owns them.
That is the difference between an informed hypothesis and pretending to see the invisible.
Buy-side and sell-side liquidity
Buy-side liquidity is commonly used to describe potential buy orders above visible highs.
Sell-side liquidity describes potential sell orders below visible lows.
Again, the labels can be useful if we understand what they mean.
Above a high, potential buy orders can include:
- Stops from traders who are short
- Breakout orders from traders who want to buy strength
- Market orders triggered after the break
Below a low, potential sell orders can include:
- Stops from traders who are long
- Breakdown orders from traders who want to sell weakness
- Market orders triggered after the break
The language helps us think about where participation may increase.
But there is no need to turn it into mythology.
Price does not need to be controlled by a mysterious actor hunting your individual stop for those areas to matter.
Obvious levels matter because many market participants can see the same structure.
What is a liquidity sweep?
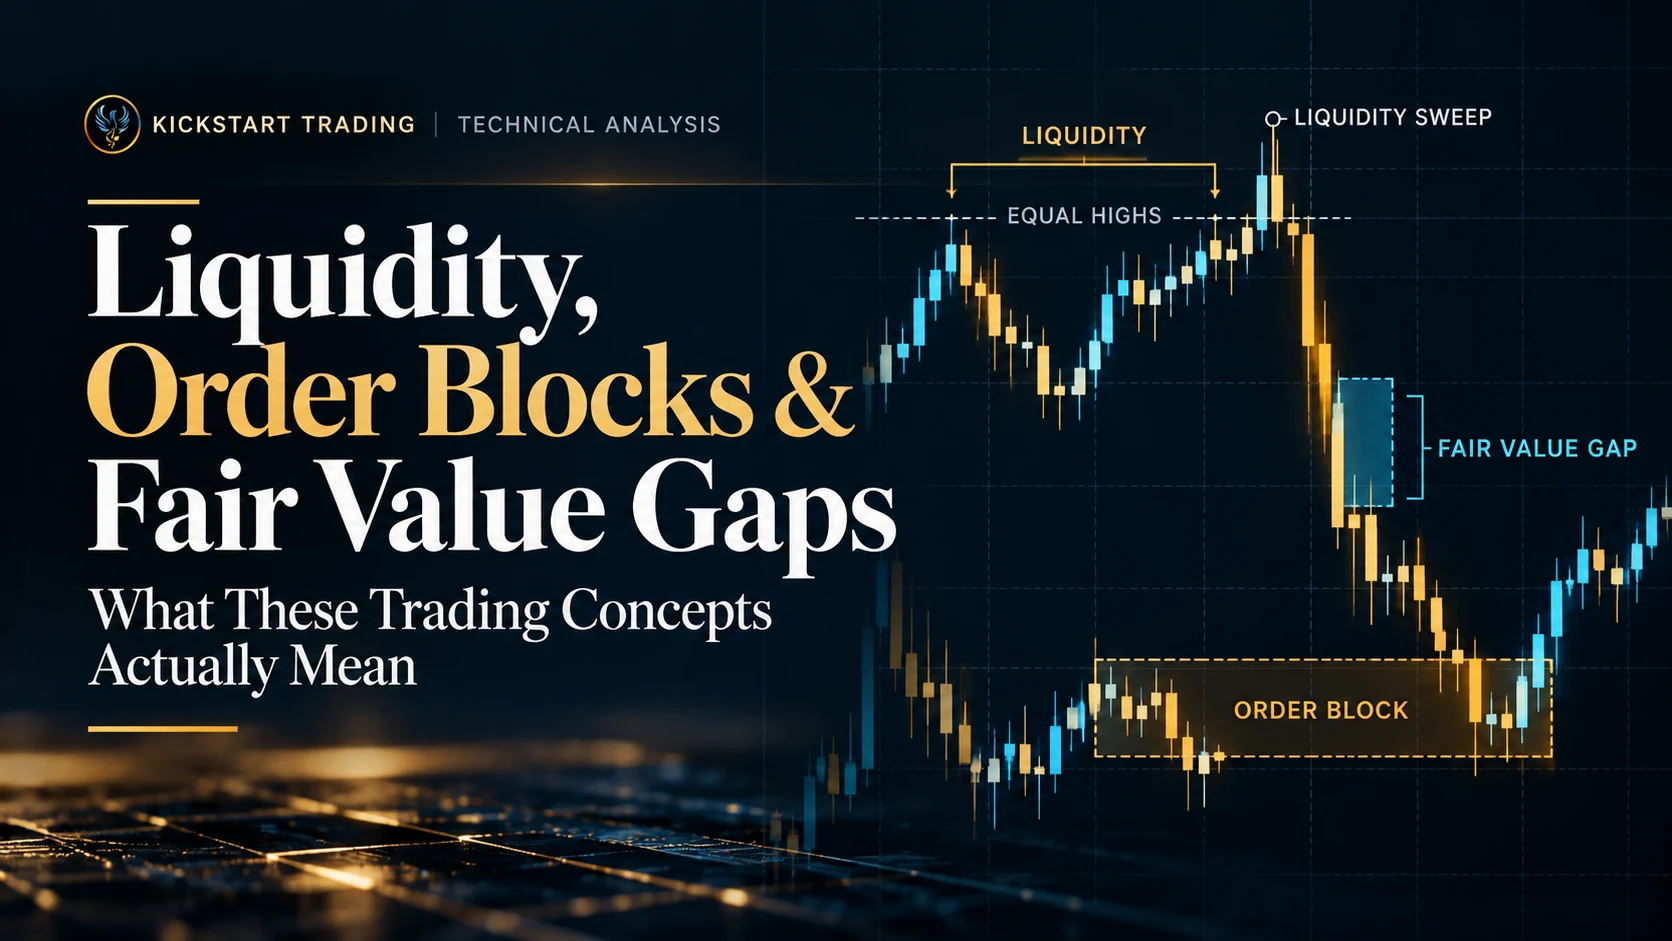
A liquidity sweep describes a move through an obvious high or low that then fails to continue and rejects back into the previous structure.
If you have traded for any length of time, you already know the behaviour even if you used a different name for it.
You may have called it:
- A false breakout
- A stop run
- A failed break
- A fakeout
- A rejection beyond structure
The newer liquidity language gives the move an order-flow explanation: clustered stops and breakout orders are triggered beyond the level, creating a burst of transactions. If the market cannot continue after that activity, price may reverse.
That explanation is plausible.
But the reaction is more important than the story.
Suppose EUR/USD trades above yesterday’s high.
That alone is not a short signal.
If price breaks above, accepts above the high, and continues making higher highs, the supposed “liquidity sweep” was simply a breakout.
If price trades above the high, immediately rejects, closes back beneath it, and then breaks short-term structure lower, that is very different information.
This is why I would never teach liquidity as:
Price will go here because liquidity is there.
I would teach it as:
This is an obvious area where order activity may increase. Let’s see what price actually does when it gets there.
That is a much healthier way to trade.
Support and resistance versus supply and demand
Before going deeper into order blocks, it helps to separate them from older concepts.
Traditional support and resistance focus primarily on where price has reacted.
A demand zone or supply zone usually focuses more on where a strong move originated.
Those ideas overlap constantly.
A strong demand zone may also sit at support. A supply zone may line up with resistance. A broken resistance level may become support while also overlapping the origin of an impulsive bullish move.
The labels are less important than the logic.
I go into that distinction properly in Support and Resistance vs Supply and Demand Zones.
The reason it matters here is that order blocks are often another way of refining the origin of a strong move.
What is an order block?
An order block is a term associated with Smart Money Concepts and ICT-style analysis.
Definitions vary between educators, but it is commonly marked as the final opposing candle, or a small base, before a strong directional move.
For example, before a powerful rally, a trader might mark the final bearish candle before the bullish displacement as a bullish order block.
Before a powerful decline, they may mark the final bullish candle before the bearish displacement as a bearish order block.
The useful part of the idea is straightforward:
Where did the important move begin?
That is a reasonable technical-analysis question.
The dangerous part comes when the explanation becomes:
Institutions placed orders in this candle and still have unfilled orders there, therefore price must return.
A standard price chart does not prove that.
The term order block should also not be confused with an actual order book. An exchange order book contains bids and offers. An order block is a charting label applied to historical price action.
Those are completely different things.
That distinction may sound pedantic, but it protects the trader from false certainty.
Order blocks versus supply and demand zones
This is where many traders end up drawing the same area with different terminology.
A demand trader might draw a broad base before an impulsive rally.
An order-block trader might mark the final bearish candle inside that same base.
A support-and-resistance trader might mark the prior swing or breakout level running through the same area.
Three traders. Three labels. Similar piece of chart.
There can be differences in the exact rules each framework uses, but there is also a great deal of overlap.
That is why I would not choose a framework because its vocabulary sounds more sophisticated.
Choose it because you can define it consistently and test it.
What is displacement?
Displacement describes a strong directional move that covers meaningful distance quickly.
Typical characteristics may include:
- Large candle bodies relative to recent candles
- Limited overlap between candles
- Strong closes near the end of the candle range
- A meaningful break or extension of market structure
- Rapid movement away from a base or level
Displacement can be useful because it asks an important question:
Did price actually leave this area with conviction?
If price drifts away slowly and immediately returns, the origin may not mean much.
If price explodes away, breaks a meaningful swing, and does not look back for some time, the area becomes more interesting.
But again, displacement does not tell us who caused the move.
It tells us what price did.
That is enough.
What is an imbalance?
Imbalance is another word that needs careful definition because different traders use it differently.
In a broad market sense, imbalance can describe one-sided buying or selling pressure.
In order-flow tools, imbalance may refer to a measurable difference between buying and selling activity.
In price-action communities, imbalance often describes a rapid move where there appears to have been relatively little two-way trading.
Those are related ideas, but they are not identical data.
When somebody says, “There is an imbalance here,” the useful question is:
What exactly are you measuring?
If the answer is a candle pattern, define the candle pattern.
If the answer is order-flow data, define the data.
That makes the idea testable.
What is a fair value gap?
A fair value gap, commonly shortened to FVG, is another concept heavily associated with ICT-style analysis.
The common three-candle definition works like this.
During a strong bullish move:
- Candle one has a high
- Candle two expands strongly upward
- Candle three has a low that remains above candle one’s high
The area between candle one’s high and candle three’s low is labelled the bullish fair value gap.
The bearish version is the opposite.
The idea is that price moved through the area so aggressively that there was limited overlap between the surrounding candles.
That can be a useful way to describe rapid price movement.
But the name fair value gap causes unnecessary confusion.
It does not mean we have calculated the fair economic value of EUR/USD, gold, the S&P 500, or anything else.
It is a chart pattern.
And there is no market law saying price must come back and “fill” every FVG.
Some do.
Some partially fill.
Some never return.
The question is whether the pattern adds value within a tested setup.
Fair value gaps versus ordinary price gaps
A fair value gap is not necessarily the same thing as a conventional market gap.
A conventional gap occurs when one period opens at a materially different price from the prior period’s close, leaving prices that did not trade between them.
An FVG can form even though the market traded continuously through the area. The pattern is based on the relationship between three candle ranges, not necessarily an absence of all transactions at those prices.
That difference matters.
Calling both things a “gap” can make traders think they represent the same market event when they do not.
How liquidity, order blocks and FVGs fit together
This is the part that attracts traders to the framework.
A clean setup might be described like this:
- Price forms an obvious swing high.
- Buy-side liquidity is inferred above that high.
- Price trades above the high and rejects.
- Bearish displacement breaks short-term structure.
- The displacement leaves a bearish fair value gap.
- The final bullish candle before the move is marked as a bearish order block.
- Price retraces into that area.
- The trader looks for confirmation and defines invalidation above the relevant structure.
That is a coherent narrative.
It can absolutely be turned into a set of trading rules.
But notice what makes it useful.
It is not the words.
It is the sequence of observable conditions.
High. Sweep. Rejection. Structural break. Displacement. Retracement. Invalidation.
If you can define those things objectively enough to test them, you may have the beginnings of a strategy.
If the explanation changes every time the chart changes, you have hindsight dressed up as analysis.
The biggest problem with Smart Money language
The biggest problem is not the concepts themselves.
It is the certainty that sometimes surrounds them.
You will hear statements like:
- “The banks are manipulating price to take retail liquidity.”
- “Institutions have unfilled orders in this block.”
- “Price has to fill the imbalance.”
- “The algorithm needs to take this liquidity before moving higher.”
Some of those stories may occasionally describe what happened.
But a candle chart usually cannot prove them.
The market is made up of different participants with different horizons, hedges, inventory needs, risk limits, execution algorithms, stop orders, passive orders, market orders and objectives.
You do not need to know their identities to trade the resulting price behaviour.
In fact, pretending you know more than the data tells you can make the analysis worse.
Forex makes this even more important
Spot foreign exchange is not one single centralized exchange with one complete public order book.
Liquidity is distributed across banks, electronic communication networks, dealers, brokers and venues.
That means a retail EUR/USD chart does not show every resting euro-dollar order in the global market.
So when somebody circles an equal high on a forex chart and says, “There are exactly $800 million of institutional stops here,” ask how they know.
If there is no data source, it is a story.
The price level can still matter.
The story does not have to be true for the technical observation to be useful.
A better way to use these concepts
My preferred approach is to build from the most observable information outward.
1. Start with structure
Identify the higher-timeframe trend, range, swing highs, swing lows, support and resistance.
If the basic chart is unclear, advanced labels will not rescue it.
2. Mark obvious decision areas
Where has price reacted strongly?
Where did an important move originate?
Where are the obvious highs and lows that many traders can see?
3. Observe the approach
Is price drifting into the area?
Accelerating?
Compressing?
Already extended?
Approach matters.
4. Let price trade the level
Do not predict a sweep because you want one.
See whether price accepts beyond the level or rejects it.
5. Look for meaningful displacement
Did the reaction actually change anything?
A tiny lower-timeframe candle is not the same as a decisive move that breaks structure.
6. Use order blocks or FVGs as refinement
If these tools help you define a retracement area more consistently, use them.
But they should refine the idea, not create a trade from nothing.
7. Define invalidation before entry
This is where stop-loss placement matters.
Where is the setup objectively wrong?
Once that is known, position size can be calculated from the amount you are prepared to risk.
8. Make sure the target makes sense
The next liquidity area or structural objective may provide a logical target, but the available risk-to-reward still has to justify the trade.
If the setup requires a 40-pip stop and there is only 20 pips of realistic room, a beautiful order block does not fix the mathematics.
You do not need all of these concepts
This is important.
You can be a profitable trader without ever using the phrase fair value gap.
You can also build a perfectly valid strategy around FVGs if you define and test them properly.
The market does not care which vocabulary you prefer.
A support-and-resistance trader and an order-block trader may enter almost the same trade for slightly different reasons.
The question is not:
Which terminology is the smartest?
The better questions are:
- Can I define the setup before it happens?
- Can I identify the same setup consistently?
- Do I know where it is invalid?
- Have I tested it across enough examples?
- Does it produce positive expectancy after costs?
- Can I execute it without changing the rules emotionally?
That is what makes a trading framework useful.
Keep the chart clean
Once traders discover liquidity, order blocks and FVGs, there is a temptation to annotate everything.
Five order blocks.
Nine gaps.
Three liquidity pools.
Every swing labelled.
Every candle given a narrative.
Soon the chart becomes unreadable.
The same rule applies here that applies to support and resistance: mark what matters.
If an area does not change your decision, it probably does not need to be on the chart.
Technical analysis should reduce uncertainty enough to make a decision.
It should not create a museum of rectangles.
Final thoughts
Liquidity is real.
Order books are real.
Stops and breakout orders are real.
Markets genuinely can accelerate around obvious levels.
Strong price displacement is observable.
False breaks are observable.
The origin of a move can be useful.
The mistake is turning those observations into claims the chart cannot prove.
Order blocks, fair value gaps, liquidity sweeps and supply-and-demand zones can all be useful frameworks for organising price action.
They are not magic institutional footprints.
Use the concepts that make your process clearer.
Define them.
Test them.
Place risk where the idea is actually invalid.
And remember that the quality of your trading will always depend more on a repeatable process than on having the most sophisticated vocabulary on the chart.
To your health, wealth, and happiness, always,
Chris