Support and resistance are usually among the first technical-analysis concepts a trader learns.
Supply and demand often arrive later, usually presented as something more advanced.
That can make the two frameworks sound more different than they really are.
One trader says price is returning to support.
Another says it is entering demand.
One trader marks a resistance level.
Another draws a supply zone across almost the same area.
Sometimes they are describing genuinely different information.
Sometimes they are describing the same piece of market structure with different language.
The useful question is not which vocabulary sounds more sophisticated. It is what information the level or zone is actually giving you.
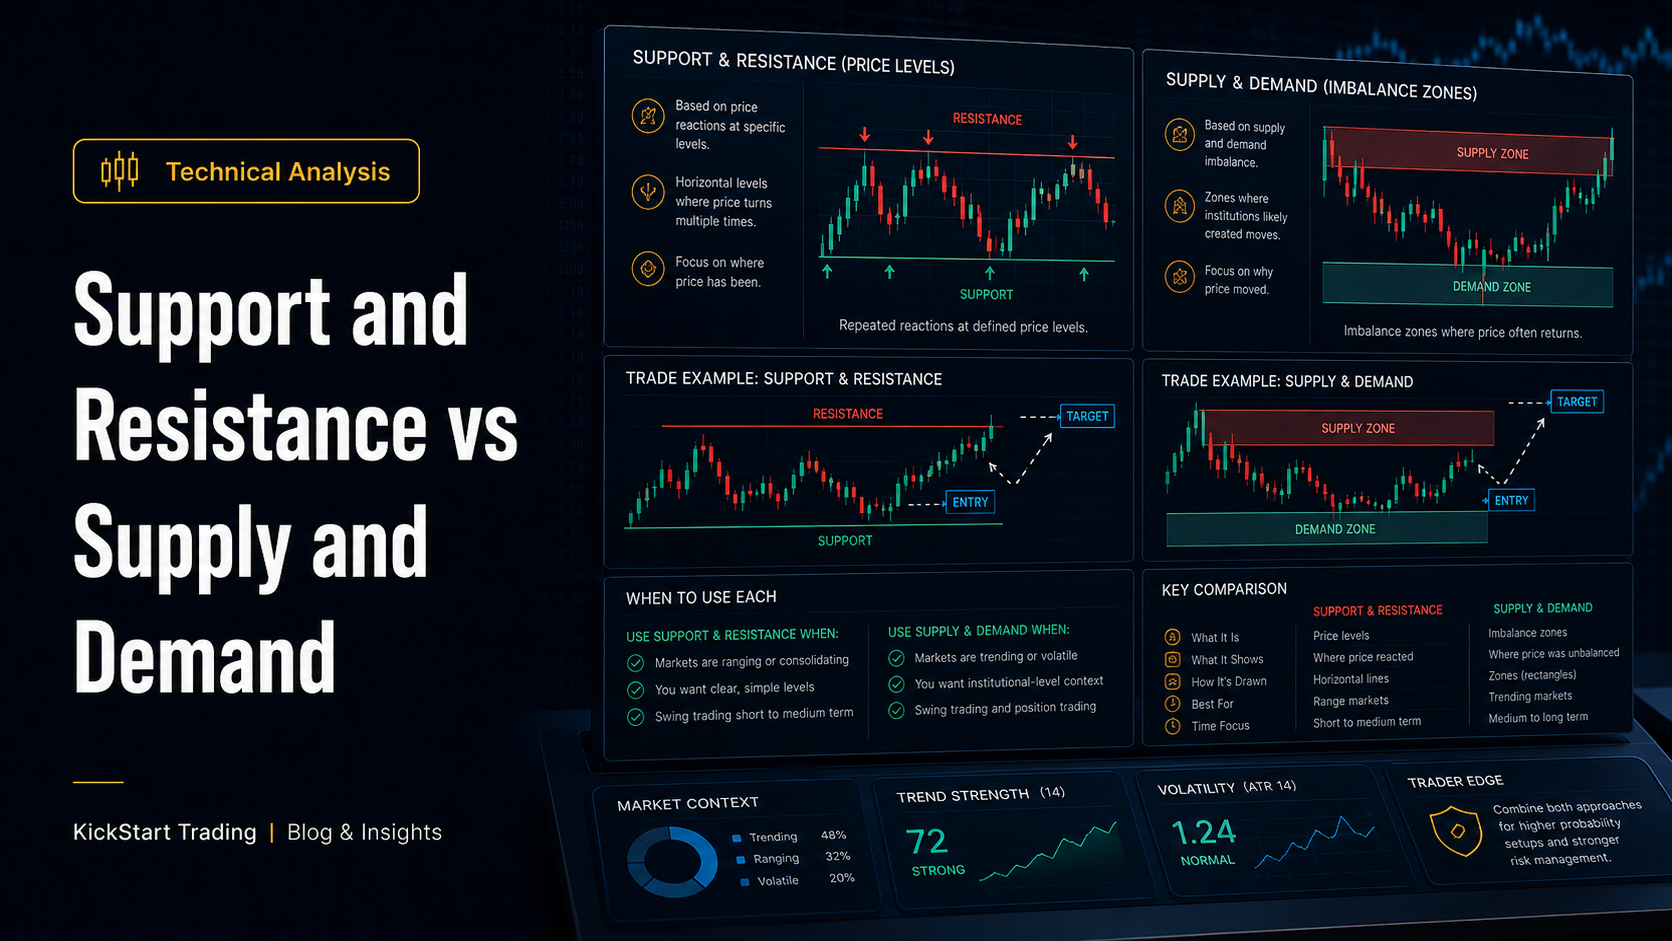
Support and resistance describe reaction areas
Support is an area where price has previously found enough buying interest, short covering, or reduced selling pressure to slow or reverse a decline.
Resistance is the opposite: an area where price has previously met enough selling interest, profit taking, or reduced buying pressure to slow or reverse an advance.
Notice that both definitions begin with observed price behaviour.
We know price reacted there because the chart shows us the reaction.
That does not mean the area must hold next time.
A support level is not a floor built into the market.
A resistance level is not a ceiling.
They are areas where something meaningful happened before, which makes them reasonable places to pay attention again.
That is why I prefer to think of support and resistance as decision areas, not prediction tools.
Supply and demand focus more on the origin of movement
A demand zone is usually drawn around the base or origin of a strong upward move.
A supply zone is usually drawn around the base or origin of a strong downward move.
The question changes slightly.
Instead of asking:
Where has price reacted before?
The supply-and-demand trader asks:
Where did this important move begin?
That can produce a different area on the chart.
Imagine price consolidates around 1.2500 and then rallies aggressively to 1.2700.
A support trader may later focus on a swing low at 1.2550 or the breakout level around 1.2600.
A demand trader may mark the original 1.2490 to 1.2520 base where the rally began.
Both can be reasonable.
They are simply organising the same market move from different reference points.
A level and a zone are not the same thing
This distinction is useful.
A level is usually a relatively precise price reference.
A zone intentionally covers a range of prices.
In practice, support and resistance often work better as zones too.
Markets rarely reverse to the exact pip because the orders and decisions behind price are not all sitting on one perfect horizontal line.
Price can:
- Wick through a level
- Miss it slightly
- Trade through part of an area and reject
- React from the upper or lower edge of a broader zone
- Break the area completely
So when somebody says, “support is 1.2500,” I normally interpret that as shorthand for an area around 1.2500 unless the strategy genuinely requires an exact price.
Supply and demand traders make that flexibility explicit by drawing rectangles rather than thin lines.
Why these concepts overlap so often
Support, resistance, supply and demand are all trying to answer a similar question:
Where might price become more interesting?
A demand zone can sit inside support.
A supply zone can sit inside resistance.
A previous resistance area can break, become support, and overlap a new demand zone created by the breakout.
A previous support area can break, become resistance, and overlap supply created by the selloff.
This is why arguing that one framework is always “right” and the other is “wrong” is not especially useful.
The market does not label its own chart.
The label is ours.
What matters is whether the method helps us identify the same kinds of areas consistently enough to test and trade them.
Support and resistance are usually easier to define
For most newer traders, support and resistance are the cleaner starting point.
You can begin with obvious structure:
- Major swing highs
- Major swing lows
- Range boundaries
- Prior breakout levels
- Previous areas of repeated rejection
That gives the chart a basic framework.
The best levels are usually not the ones you have to force onto the chart.
If you need twelve lines to explain where support is, you probably do not have a useful support level.
This is one reason market structure matters so much. A level means more when you understand whether it sits inside an uptrend, downtrend, range, pullback, or reversal.
Supply and demand ask for a stronger departure
A supply or demand zone is normally more persuasive when price leaves it with obvious strength.
That strong departure is sometimes called displacement.
You may see:
- Large directional candles
- Limited overlap
- Strong closes
- A break of a meaningful swing
- Rapid expansion away from the base
The logic is simple.
If price barely drifts away from an area, the origin of that move may not be especially important.
If price accelerates away and changes the structure of the market, the origin deserves more attention.
This does not prove that “institutions” left an unfilled order behind.
It simply tells us the area preceded a meaningful change in price.
That is enough to make it useful.
Be careful with the institutional-order story
Supply-and-demand education is sometimes taught with a very specific explanation:
Large institutions could not fill their whole order, so unfilled orders remain in the zone and price will return for them.
That is possible in some circumstances.
But a normal candle chart does not prove it.
In a centralized futures market, traders can access forms of actual market-depth data. CME Group’s Market by Order documentation describes order-level information such as queue position and full depth of book.
That is very different from looking at a historical candle and inferring that a particular institution still has an order waiting there.
The zone can be useful without making that claim.
We can observe that price left strongly.
We can observe whether structure changed.
We can observe what happens if price returns.
Those observations are enough to build a trading framework.
Fresh zones and tested zones
Supply-and-demand traders often distinguish between fresh and tested zones.
A fresh zone has not been revisited since the original move away.
A tested zone has already seen price return.
The theory is that the first return may have more potential because less of the original interest has been consumed.
There is a similar idea in support and resistance.
Repeated tests can show that a level matters, but they can also weaken it as buying or selling interest is gradually absorbed.
Neither principle is a law.
Sometimes a level holds six times.
Sometimes it fails on the second test.
What matters is the behaviour of price as the tests accumulate.
Is the reaction becoming weaker?
Is price compressing into the area?
Are the pullbacks getting shallower?
Is momentum increasing into the level?
Those questions are more useful than simply counting touches.
Support can become resistance
One of the most useful traditional concepts is role reversal.
When support breaks, that same area may later act as resistance.
When resistance breaks, the area may later become support.
There are several possible reasons.
Traders caught on the wrong side may exit around their original entries. Traders who missed the breakout may wait for a retest. New traders may see the old level as confirmation of the new direction.
The result can be renewed activity around the same price area.
Again, the important word is may.
Role reversal is a framework for reading the retest, not a guarantee that it will happen.
Supply can become demand too
The same logic can be applied to zones.
If price breaks decisively through an old supply zone, the previous selling area may lose its significance.
On a later return, buyers may defend the same region and traders may relabel it demand.
Likewise, a broken demand zone can later become supply.
This is why old drawings should never become emotional commitments.
When structure changes, the analysis has to change with it.
Your chart is a working model, not a courtroom argument you have to win.
Where liquidity fits in
This is where newer trading terminology begins to overlap with both frameworks.
Obvious highs, lows and range boundaries may attract stop orders, breakout orders and exits. Traders often refer to those potential clusters as liquidity pools.
That can explain why price occasionally trades just beyond a clean support or resistance area and then snaps back.
Some traders call that a false breakout.
Others call it a liquidity sweep.
The behaviour is more important than the label.
I cover liquidity, order blocks, imbalances and fair value gaps in much more depth in Liquidity, Order Blocks and Fair Value Gaps: What These Trading Concepts Actually Mean.
The important point here is that support and resistance should not be abandoned simply because newer vocabulary exists.
The newer concepts often sit on top of the same underlying price structure.
Order blocks are another refinement of the origin
An order block is commonly marked as the final opposing candle, or small base, before a strong directional move.
That means an order block can sit inside a broader supply or demand zone.
A demand trader might draw the whole base.
An order-block trader might refine the area to one candle.
The question is whether that refinement actually improves the strategy.
A smaller zone can produce a tighter stop and more attractive theoretical reward-to-risk.
It can also cause more missed trades and more stop-outs if the market reacts from the broader area instead.
There is no free precision.
Every refinement changes both opportunity and failure rate.
That is why it needs testing.
Fair value gaps can add another layer, but not certainty
A fair value gap is a three-candle pattern used in ICT-style analysis to identify a rapid move with limited overlap between the first and third candles.
Some traders use an FVG inside a supply or demand area as additional confluence.
That can create a very specific entry model.
For example:
- Higher-timeframe demand is identified.
- Price sweeps a prior low.
- Bullish displacement breaks short-term structure.
- The displacement leaves a bullish FVG.
- Price retraces into the FVG or nearby order block.
- The trader looks for an entry with invalidation beneath the structure.
That sequence can be tested.
The problem begins when the trader assumes every FVG must fill or every order block must hold.
No technical concept deserves that level of certainty.
Which framework should you use?
The one you can define and test.
Seriously.
If traditional support and resistance gives you a cleaner chart and better decisions, use it.
If supply and demand helps you identify the origin of important moves more consistently, use it.
If order blocks and FVGs improve your entry refinement without making the chart subjective, use them.
You do not receive extra points for using more terminology.
A simple framework applied consistently is better than an advanced framework that changes every time a trade loses.
A practical chart workflow
Here is a clean way to combine the ideas without covering the chart in rectangles.
1. Start with the higher timeframe
Identify the dominant structure.
Is price trending, ranging, or transitioning?
Mark only the most obvious swing highs, swing lows and major reaction areas.
2. Mark broad support and resistance
These give you the basic map.
Where has price clearly responded before?
Where are the range edges?
Where did important breakouts occur?
3. Look for meaningful supply or demand inside those areas
Where did the strongest moves begin?
Did the departure create displacement?
Did it break structure?
Was the area clean enough to define consistently?
4. Watch what happens on the return
Do not enter simply because price touches your rectangle.
Does the market reject?
Does it accept through the zone?
Is there a liquidity sweep?
Does lower-timeframe structure change?
5. Refine only if refinement improves the plan
An order block or FVG may help narrow the entry.
But if the refinement makes you miss valid trades or place stops inside normal market noise, it is not automatically an improvement.
6. Define invalidation before position size
Your stop loss should sit where the trade idea is genuinely wrong, not where a random number of pips looks comfortable.
Then calculate position size so that the money at risk fits the plan.
7. Check the available reward
A strong zone with no room to the next obstacle may still be a poor trade.
Use the actual target structure to evaluate the risk-to-reward ratio rather than inventing a target simply to achieve 1:2 or 1:3.
The biggest charting mistake: too many areas
Once traders learn zones, they often find them everywhere.
Every base becomes demand.
Every bearish candle becomes supply.
Every high becomes liquidity.
Every strong candle creates an order block and an FVG.
The chart quickly becomes useless.
A good rule is that an area should earn its place.
Does it sit at meaningful structure?
Did price leave it with strength?
Did the move accomplish something?
Will the area change your decision if price returns?
If the answer is no, delete it.
The goal of technical analysis is not to explain every candle.
It is to make better decisions with controlled risk.
Final thoughts
Support and resistance and supply and demand are closely related, but they are not identical.
Support and resistance focus primarily on where price has reacted.
Supply and demand focus more on where an important move began.
Order blocks can refine that origin further.
Liquidity concepts can help explain why obvious highs and lows become active areas.
Fair value gaps can describe rapid displacement and provide another retracement reference.
But none of those labels remove uncertainty.
The trader still has to read context, define invalidation, manage risk, and test whether the framework actually produces an edge.
Use the language that makes the chart clearer.
Discard the language that makes you feel certain about things you cannot actually know.
That is the difference between technical analysis as a useful framework and technical analysis as storytelling.
To your health, wealth, and happiness, always,
Chris