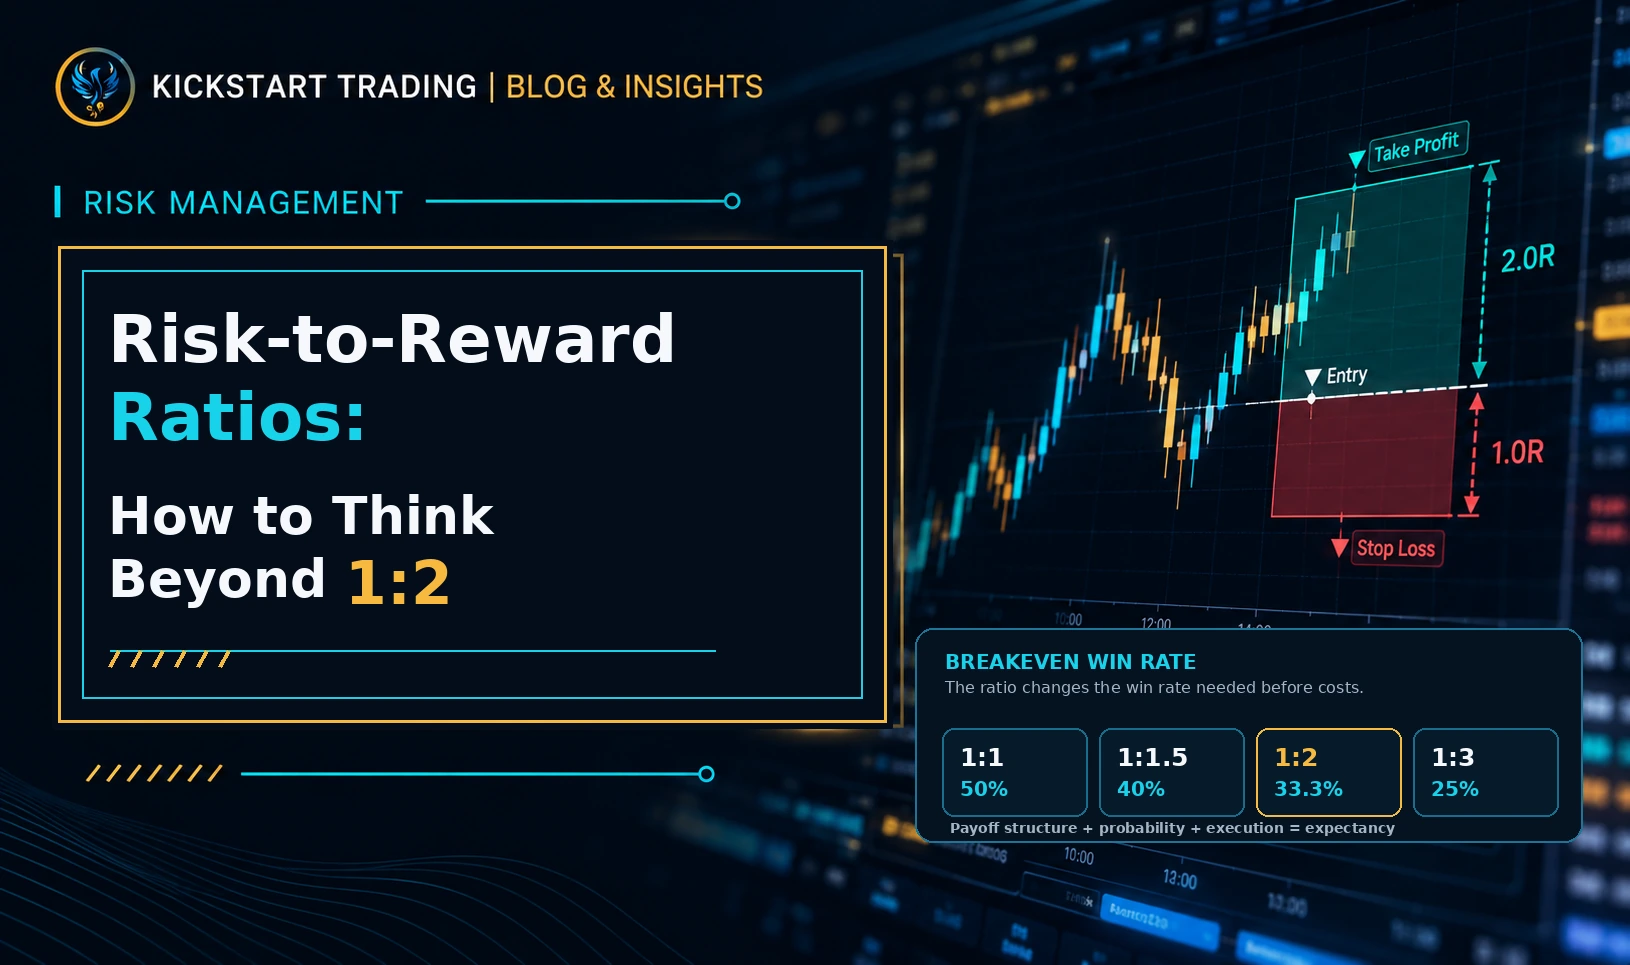
Risk-to-Reward Ratios: How to Think Beyond 1:2
“Never take a trade unless it offers at least 1:2.”
It sounds disciplined.
It sounds mathematical.
And it is one of the most repeated pieces of advice in trading.
But taken too literally, it can also become a problem.
Risk-to-reward ratio is an important part of trade planning. It helps a trader understand how much they are prepared to lose relative to how much they hope to make.
But the ratio alone does not tell you whether a trade is good.
A 1:3 setup is not automatically better than a 1:1.5 setup.
A trader targeting 3R is not automatically more disciplined than a trader targeting 1.5R.
And forcing every setup to fit a minimum 1:2 target can lead traders to place unrealistic profit targets, ignore market structure, or reject perfectly valid strategies.
The better approach is to understand what risk-to-reward actually measures, how it interacts with win rate and expectancy, and why the quality of the trade matters more than chasing a particular number.
What is a risk-to-reward ratio?
A risk-to-reward ratio compares the amount a trader is willing to lose with the amount they expect to gain if the trade reaches its target.
If you risk $100 to potentially make $200, the trade has a 1:2 risk-to-reward ratio.
If you risk $100 to potentially make $300, the ratio is 1:3.
If you risk $200 to make $200, the ratio is 1:1.
In R-multiple terms:
- A full planned loss is usually -1R
- A winner twice the size of the planned risk is +2R
- A winner three times the size of the planned risk is +3R
This creates a useful common language.
Instead of saying one trade made $400 and another lost $250, a trader can think in terms of how each outcome compared with the risk originally taken.
That becomes especially useful when reviewing performance across different account sizes or position sizes.
The basic calculation
The basic ratio is straightforward.
Suppose a trader buys at 100.
The stop loss is at 98.
The profit target is at 104.
The trader is risking 2 points to potentially make 4 points.
That gives:
Risk = 2
Reward = 4
Risk-to-reward = 1:2
The same logic applies whether the instrument is forex, futures, equities, gold, or an index.
The monetary position size may change.
The relationship between stop and target remains the same.
If you want to check a setup quickly, the free KickStart Risk / Reward Calculator lets you compare entry, stop, target, potential risk, potential reward, and the corresponding ratio before entering the trade.
Why traders are taught to look for 1:2
The appeal of 1:2 is easy to understand.
If the average winner is twice the size of the average loser, the trader does not need to win every trade to be profitable.
Ignoring trading costs for a moment, a true 1:2 system has a theoretical breakeven win rate of approximately 33.3%.
That means a trader could lose more trades than they win and still potentially make money.
For example, across ten trades:
- Four winners at +2R = +8R
- Six losers at -1R = -6R
- Net result = +2R
The trader only won 40% of the trades.
Yet the series was profitable because the winners were larger than the losers.
This is the useful idea behind the 1:2 rule.
It teaches traders that win rate alone is not enough.
Breakeven win rate matters
Every reward-to-risk profile implies a different theoretical breakeven win rate.
Ignoring costs:
- 1:1 requires a 50% win rate to break even
- 1:1.5 requires 40%
- 1:2 requires about 33.3%
- 1:3 requires 25%
- 1:4 requires 20%
This is why larger reward multiples can look attractive.
The trader can theoretically be wrong more often and still survive.
But there is an important catch.
As targets move farther away, they may also become harder to reach.
The market does not care that a trader wants 3R.
The target still has to be realistic.
A higher ratio is not automatically a better trade
This is where many traders get confused.
Imagine two setups.
Trade A offers 1:2.
Trade B offers 1:4.
At first glance, Trade B looks much better.
But suppose Trade A reaches its target 48% of the time, while Trade B reaches its target only 18% of the time.
Now the picture changes.
For Trade A:
Expectancy = (0.48 × 2R) - (0.52 × 1R)
Expectancy = 0.96R - 0.52R = +0.44R per trade
For Trade B:
Expectancy = (0.18 × 4R) - (0.82 × 1R)
Expectancy = 0.72R - 0.82R = -0.10R per trade
The larger target produced the worse system.
This is why risk-to-reward cannot be evaluated in isolation.
Probability matters.
Expectancy is more useful than ratio alone
Expectancy asks a more complete question:
Over a large sample of trades, how much does the strategy expect to make or lose per unit of risk?
A simplified expectancy formula is:
Expectancy = (Win Rate × Average Winner) - (Loss Rate × Average Loser)
Suppose a trader wins 45% of trades.
The average winner is 1.5R.
The average loser is 1R.
The calculation becomes:
(0.45 × 1.5) - (0.55 × 1)
0.675 - 0.55 = +0.125R
That system has positive expectancy before costs.
Now consider a trader who wins 70% of trades with an average winner of only 0.8R and an average loser of 1R.
(0.70 × 0.8) - (0.30 × 1)
0.56 - 0.30 = +0.26R
The second system has the lower reward multiple but the stronger expectancy.
That does not make it automatically superior in every practical sense, but it demonstrates why “never take less than 1:2” is too simplistic.
The market should help determine the target
One of the biggest mistakes traders make is choosing the reward ratio first.
They decide every trade must target 2R or 3R.
Then they place the target wherever that number happens to fall.
That reverses the process.
A profit target should have a market-based reason.
Depending on the strategy, that might include:
- Previous swing highs or lows
- Support and resistance
- Supply or demand zones
- Liquidity areas
- Session highs or lows
- Volatility expectations
- Measured moves
- Higher-timeframe structure
- A predefined systematic exit rule
The target should reflect what the market is reasonably capable of doing.
Then the trader can evaluate whether the resulting risk-to-reward relationship is attractive enough.
The ratio should help evaluate the setup.
It should not invent the setup.
The stop should also have a real reason
The same principle applies to risk.
A trader should not tighten the stop simply to manufacture a better ratio.
Imagine a setup where the technically valid stop belongs 30 points away.
The realistic target is 45 points away.
That gives a 1:1.5 trade.
A trader who insists on 1:2 may decide to tighten the stop to 22.5 points.
On paper, the ratio has improved.
In reality, the trade may now be more likely to stop out because the stop sits inside normal market movement.
The trader did not improve the trade.
They changed the mathematics while weakening the technical logic.
This is why position sizing matters.
If the setup genuinely requires a wider stop, reduce the position size so the monetary risk remains controlled.
The KickStart Position Size Calculator is designed to help with exactly that calculation.
Planned R versus realised R
Another important distinction is the difference between planned risk-to-reward and realised risk-to-reward.
A trader may plan a 1:3 trade.
But if they repeatedly close winners at 1R because they become nervous, the realised performance is not 1:3.
Similarly, a trader may plan to lose only 1R but then move the stop and eventually take a 1.5R loss.
The plan may look excellent.
The execution may be completely different.
This is why journals should track actual outcomes in R.
A useful review might include:
- Planned stop
- Planned target
- Planned R multiple
- Actual exit
- Realised R multiple
- Reason for early exit
- Whether the stop was changed
- Whether partial profits altered the result
Over time, this shows whether the trader is actually executing the model they believe they are trading.
A 1:2 setup can still be bad
A risk-to-reward ratio does not create edge.
This point cannot be overstated.
A trader can take random entries, place stops 20 points away, place targets 40 points away, and create endless 1:2 setups.
That does not make the strategy profitable.
The market still needs a reason to move in the trader’s favour.
A ratio measures the payoff structure if the trade works.
It does not measure the probability that it will work.
That probability comes from the trading method.
Technical context, execution rules, market conditions, and historical testing all matter.
A 1:1 setup can still be excellent
The opposite is also true.
Some traders dismiss any setup that offers less than 1:2.
But a 1:1 setup can be profitable if the win rate is sufficiently strong and trading costs do not destroy the edge.
For example, suppose a strategy produces:
- 62% winners at +1R
- 38% losers at -1R
Expectancy is:
(0.62 × 1) - (0.38 × 1) = +0.24R per trade
That is a positive expectancy.
Again, this does not mean everyone should suddenly trade 1:1.
It means the full distribution of outcomes matters more than a slogan.
Transaction costs matter
The simple breakeven figures above assume no trading costs.
Real trading includes friction.
Depending on the market and broker, that can include:
- Spread
- Commission
- Slippage
- Swap or financing costs
- Exchange and data fees
- Less favourable fills during volatility
This matters particularly for strategies with small targets.
A nominal 1:1 trade may not truly be 1:1 after costs.
If a trader risks $100 to make $100 but pays $8 in total trading costs, the actual payoff relationship is weaker than the headline ratio suggests.
That is why testing should use realistic execution assumptions.
Win rate and risk-to-reward work together
Traders sometimes argue about whether win rate or risk-to-reward matters more.
That is the wrong argument.
They are connected.
A strategy with a very high win rate can tolerate smaller average winners.
A strategy with a lower win rate generally needs larger winners to compensate.
The relationship is what matters.
Consider these simplified examples before costs:
System A
- Win rate: 70%
- Average winner: 0.8R
- Average loser: 1R
- Expectancy: +0.26R
System B
- Win rate: 45%
- Average winner: 1.5R
- Average loser: 1R
- Expectancy: +0.125R
System C
- Win rate: 30%
- Average winner: 3R
- Average loser: 1R
- Expectancy: +0.20R
All three can theoretically be profitable.
They simply arrive there differently.
Why very high reward targets can be psychologically difficult
Large R targets come with trade-offs.
If a strategy aims for 4R or 5R, winners may occur less frequently.
That can mean longer losing streaks.
A trader may experience several losses before one large winner arrives.
Mathematically, that may be completely normal.
Psychologically, it can be difficult.
The trader may begin:
- Cutting targets early
- Skipping valid setups
- Increasing risk after losses
- Doubting the system
- Changing strategy mid-sample
A good strategy has to be executable by the person trading it.
A theoretically attractive reward profile is useless if the trader cannot follow it consistently.
Why high win-rate systems can also be difficult
The opposite profile creates different pressure.
A high win-rate strategy may produce many small winners and occasional larger losses.
That can feel comfortable until the larger loss arrives.
If the trader becomes accustomed to winning frequently, one full loss may trigger emotional behaviour.
This is another reason to avoid judging a strategy by one metric.
Every payoff profile has a psychological character.
The trader needs to understand it.
Risk-to-reward and the 1% rule are separate concepts
It is also important not to confuse risk percentage with risk-to-reward ratio.
If a trader risks 1% of the account on a trade with a 1:2 setup:
- Maximum planned account loss = 1%
- Potential planned account gain = approximately 2%
If the trader risks 0.5% with the same 1:2 setup:
- Maximum planned account loss = 0.5%
- Potential planned account gain = approximately 1%
The ratio has not changed.
The account exposure has.
This distinction matters because a trader may have a good payoff structure but still be risking too much money.
If you have not already read it, The 1% Rule: Helpful Guideline or Oversimplified Advice? looks at the account-risk side of this problem in more detail.
Partial profits change the real ratio
Many traders do not exit the entire position at one target.
They scale out.
For example:
- 50% of the position closes at +1R
- 50% closes at +3R
The total realised outcome is not +3R.
It is:
(0.50 × 1R) + (0.50 × 3R) = +2R
This is why traders need to calculate blended outcomes accurately.
Partial exits can be useful.
But they change the mathematics.
A journal should reflect the actual weighted result rather than simply recording the furthest target reached.
Moving to breakeven also changes the distribution
Another common management technique is moving the stop to breakeven.
That may reduce the size of some losses.
But it can also convert trades that would eventually have become winners into scratches.
Whether that improves the system depends on the data.
There is no automatic answer.
A trader who frequently moves to breakeven may produce a distribution such as:
- Full winners
- Full losses
- Many 0R trades
That is different from the original fixed-stop model.
Again, the realised data matters more than the intended ratio.
Trailing stops create variable R outcomes
Trailing stops can produce a different payoff profile again.
Instead of targeting a fixed 2R or 3R, the trader may allow a trend to continue and trail behind structure.
Some winners may finish at 0.8R.
Others may finish at 2R.
Occasionally one may run to 5R or more.
In that case, the strategy should be evaluated using average realised winner and average realised loser rather than a single advertised risk-to-reward ratio.
This is particularly relevant for trend-following systems.
Risk-to-reward in funded trading
Funded trading introduces another layer.
The trader is not only trying to maximise expectancy.
They also need to stay inside account rules.
That means considering:
- Daily loss limit
- Maximum drawdown
- Static or trailing drawdown
- Consistency requirements
- Position limits
- Evaluation targets
- Time or activity rules where applicable
A trade offering 1:3 is not useful if the position size creates unacceptable drawdown risk.
Likewise, a trader should not force oversized targets simply because they want to reach an evaluation profit target quickly.
The account rules should shape risk management, but they should not destroy the trading method.
The goal is still disciplined execution.
The danger of changing targets because of account pressure
Funding environments can tempt traders to manipulate reward targets.
A trader might think:
“I only need 4% more to pass, so I’ll hold this for 4R.”
That is dangerous if the strategy does not support the target.
The market does not know how close the trader is to an evaluation goal.
Targets should remain grounded in the setup.
Account objectives should not turn valid trade management into wishful thinking.
Good traders think in distributions
One of the biggest shifts a developing trader can make is to stop evaluating individual trades as isolated events.
Instead, think in distributions.
Ask:
- What is my historical win rate?
- What is my average winner?
- What is my average loser?
- What is my average realised R?
- What is my largest normal losing streak?
- How often do I actually achieve 2R, 3R, or more?
- How often do I cut winners early?
- What happens in different market conditions?
These questions turn risk-to-reward from theory into evidence.
The best ratio is not the one that sounds impressive.
It is the one supported by the strategy’s actual behaviour.
A practical pre-trade framework
Before taking a trade, consider the sequence in this order.
1. Define the setup
Why does the trade exist?
There should be a clear strategic reason.
2. Define invalidation
Where is the trade idea objectively wrong?
That location helps determine the stop.
3. Define realistic opportunity
Where is price reasonably capable of moving based on structure, liquidity, volatility, and the rules of the strategy?
That helps determine the target.
4. Calculate the resulting ratio
Now measure the distance between entry, stop, and target.
5. Decide whether the setup meets your strategy requirements
If the resulting ratio is too poor for the historical edge, skip the trade.
Do not distort the stop or target just to make the number prettier.
6. Calculate position size
Once risk distance is known, size the trade so the monetary loss remains within the planned account risk.
7. Execute the management plan
Know in advance whether you will use fixed targets, partials, breakeven rules, or trailing exits.
This is much stronger than starting with “I need 1:2.”
When should you reject a trade because of poor risk-to-reward?
Risk-to-reward still matters.
There are times when the realistic upside simply does not justify the downside.
For example, if a setup requires a 40-point stop but the nearest major opposing structure sits only 20 points away, the trade may offer an unattractive payoff.
That does not mean the trader should squeeze the stop to 10 points and pretend the setup is now 1:2.
It may simply mean:
There is no trade.
That is an important skill.
Sometimes the correct risk-management decision is to do nothing.
What should your minimum ratio be?
There is no universal minimum.
The correct minimum should come from the strategy’s evidence.
A trader with a 65% win-rate system may be comfortable with a lower average reward multiple.
A trader with a 35% win-rate system will generally need larger winners.
The minimum should also account for costs and real execution.
If you are still developing the strategy and do not yet have reliable data, using a sensible minimum such as 1:1.5 or 1:2 can provide structure while you collect evidence.
But treat it as a provisional rule.
Not a law of markets.
Track expectancy in R, not just dollars
Dollar results can hide useful information.
If your account size changes, the same strategy may produce different monetary outcomes.
R-multiples make comparison cleaner.
For example:
- Trade 1: +1.8R
- Trade 2: -1R
- Trade 3: +0.6R
- Trade 4: -0.9R
- Trade 5: +2.4R
Those numbers reveal the payoff behaviour of the strategy.
Over a large sample, you can calculate average winner, average loser, win rate, expectancy, and drawdown in a consistent unit.
That is far more useful than simply saying, “I made $2,000 this month.”
Risk-to-reward should support the process, not dominate it
The purpose of risk-to-reward analysis is to improve decision-making.
It should help a trader answer:
Is the potential upside worth the planned downside?
It should not become a rigid obsession.
If traders spend all their time chasing large R multiples, they can lose sight of what actually creates edge:
- High-quality setups
- Consistent execution
- Correct position sizing
- Realistic exits
- Controlled losses
- Repeatable behaviour
- Honest review
Risk-to-reward is one part of that framework.
An important part.
But still only one part.
Final thoughts
The 1:2 rule is useful because it teaches traders to think about payoff before entering a trade.
That is a good habit.
But “minimum 1:2” should not become a substitute for thinking.
A strong trader does not begin with an arbitrary ratio and force the chart to fit it.
They begin with the setup.
They define where the idea is wrong.
They identify where the market can realistically go.
They calculate the resulting payoff.
Then they decide whether the opportunity is good enough.
Sometimes that will be 1:2.
Sometimes it will be 1:1.5.
Sometimes it may be 1:3 or more.
And sometimes the correct answer will be to skip the trade entirely.
What matters is whether the strategy has positive expectancy across a meaningful sample and whether the trader can execute that strategy consistently.
The ratio is not the edge.
It is part of the structure that protects and expresses the edge.
Before your next trade, use the free KickStart Risk / Reward Calculator to map the entry, stop, target, and breakeven relationship clearly before you put capital at risk.
To your health, wealth, and happiness, always,
Chris